Monitoring a Spring Boot application using Graphite/Grafana.
Monitoring a Spring Boot application using Graphite/Grafana
Remember, Everything fails –Randy Shoup(Chief Engineer, Ebay) Breaking up a monolith into micro services, brings up the increasing need to monitor micro services in Production.Spring boot is an increasingly popular framework to create microservice’s and here today we will discuss how to publish metrics gathered from a Spring boot application to graphite which in turn can be viewed in Grafana. we will use Codahale Metrics library to publish these metrics to graphite.
We will be using spring-boot-starter-actuator. This makes this exercise really simple, since a default MetricRegistry Spring bean will be created when you declare a dependency to the io.dropwizard.metrics:metrics-core library; you can also register you own @Bean instance if you need customizations. Users of the Dropwizard ‘Metrics’ library will find that Spring Boot metrics are automatically published to com.codahale.metrics.MetricRegistry. Metrics from the MetricRegistry are also automatically exposed via the /metrics endpoint.
Setup Graphite/Carbon aggregator/Grafana locally
For this exercise we will set up a docker container running graphite, carbon aggregator and grafana. I will use this github project to do this https://github.com/m30m/docker-graphite-grafana.
Once this is running, you may want to change the graphite port to be an UDP port
Let’s see some code
All code can be found here https://github.com/arnabmitra/grafana-monitoring
Firstly we need to create a Spring configuration, which sets up the graphite reporter to send metrics to graphite at configurable time intervals.
@Configuration
public class MetricsConfig {

  private static final Logger log = LoggerFactory.getLogger(MetricsConfig.class);

  @Value("${monitoring.app.name}")
  private String appName;

  @Value("${monitoring.app.prefix}")
  private String appPrefix;

  @Value("${graphite.host}")
  private String graphiteHost;

  @Value("${graphite.port}")
  private Integer graphitePort;

  @Value("${graphite.config.duration}")
  private Integer graphiteDuration;


  private final MetricRegistry metricRegistry;

  @Inject
  public MetricsConfig(MetricRegistry metricRegistry) {
    this.metricRegistry = metricRegistry;
  }

  @Bean(destroyMethod = "stop")
  GraphiteReporter graphiteReporter() throws UnknownHostException {

    // add some JVM metrics (wrap in MetricSet to add better key prefixes)
    MetricSet jvmMetrics = () -> {

      Map<String, Metric> metrics = new HashMap<>();
      metrics.put("gc", new GarbageCollectorMetricSet());
      metrics.put("file-descriptors", new FileDescriptorRatioGauge());
      metrics.put("memory-usage", new MemoryUsageGaugeSet());
      metrics.put("threads", new ThreadStatesGaugeSet());
      return metrics;
    };

    metricRegistry.registerAll(jvmMetrics);


    // create and start reporter
    //use this for TCP
    //final GraphiteSender graphite = new Graphite(new InetSocketAddress(graphiteHost, graphitePort));
    //If you want UDP reporter change this out.
    final GraphiteSender graphite = new GraphiteUDP(new InetSocketAddress(graphiteHost, graphitePort));

    final String graphiteMetricsPrefix = getGraphitePrefix(appName,appPrefix);

    log.info("the graphite metrics prefix is {}",graphiteMetricsPrefix);

    final GraphiteReporter reporter = GraphiteReporter.forRegistry(metricRegistry)
        .prefixedWith(graphiteMetricsPrefix)
        .convertRatesTo(TimeUnit.MILLISECONDS).convertDurationsTo(TimeUnit.MILLISECONDS).filter(MetricFilter.ALL)
        .build(graphite);
    reporter.start(graphiteDuration, TimeUnit.MINUTES);
    return reporter;
  }

  protected String getGraphitePrefix(String appName,String appPrefix) throws UnknownHostException {
    String hostName=(InetAddress.getLocalHost().getHostName()).replaceAll("\\.","_");

    return (appPrefix.concat(appName.replaceAll("\\.","_"))
        .concat(".").concat(hostName));
  }
}
That’s really it, the rest of the work will be done automatically by spring-boot-actuator-starter.
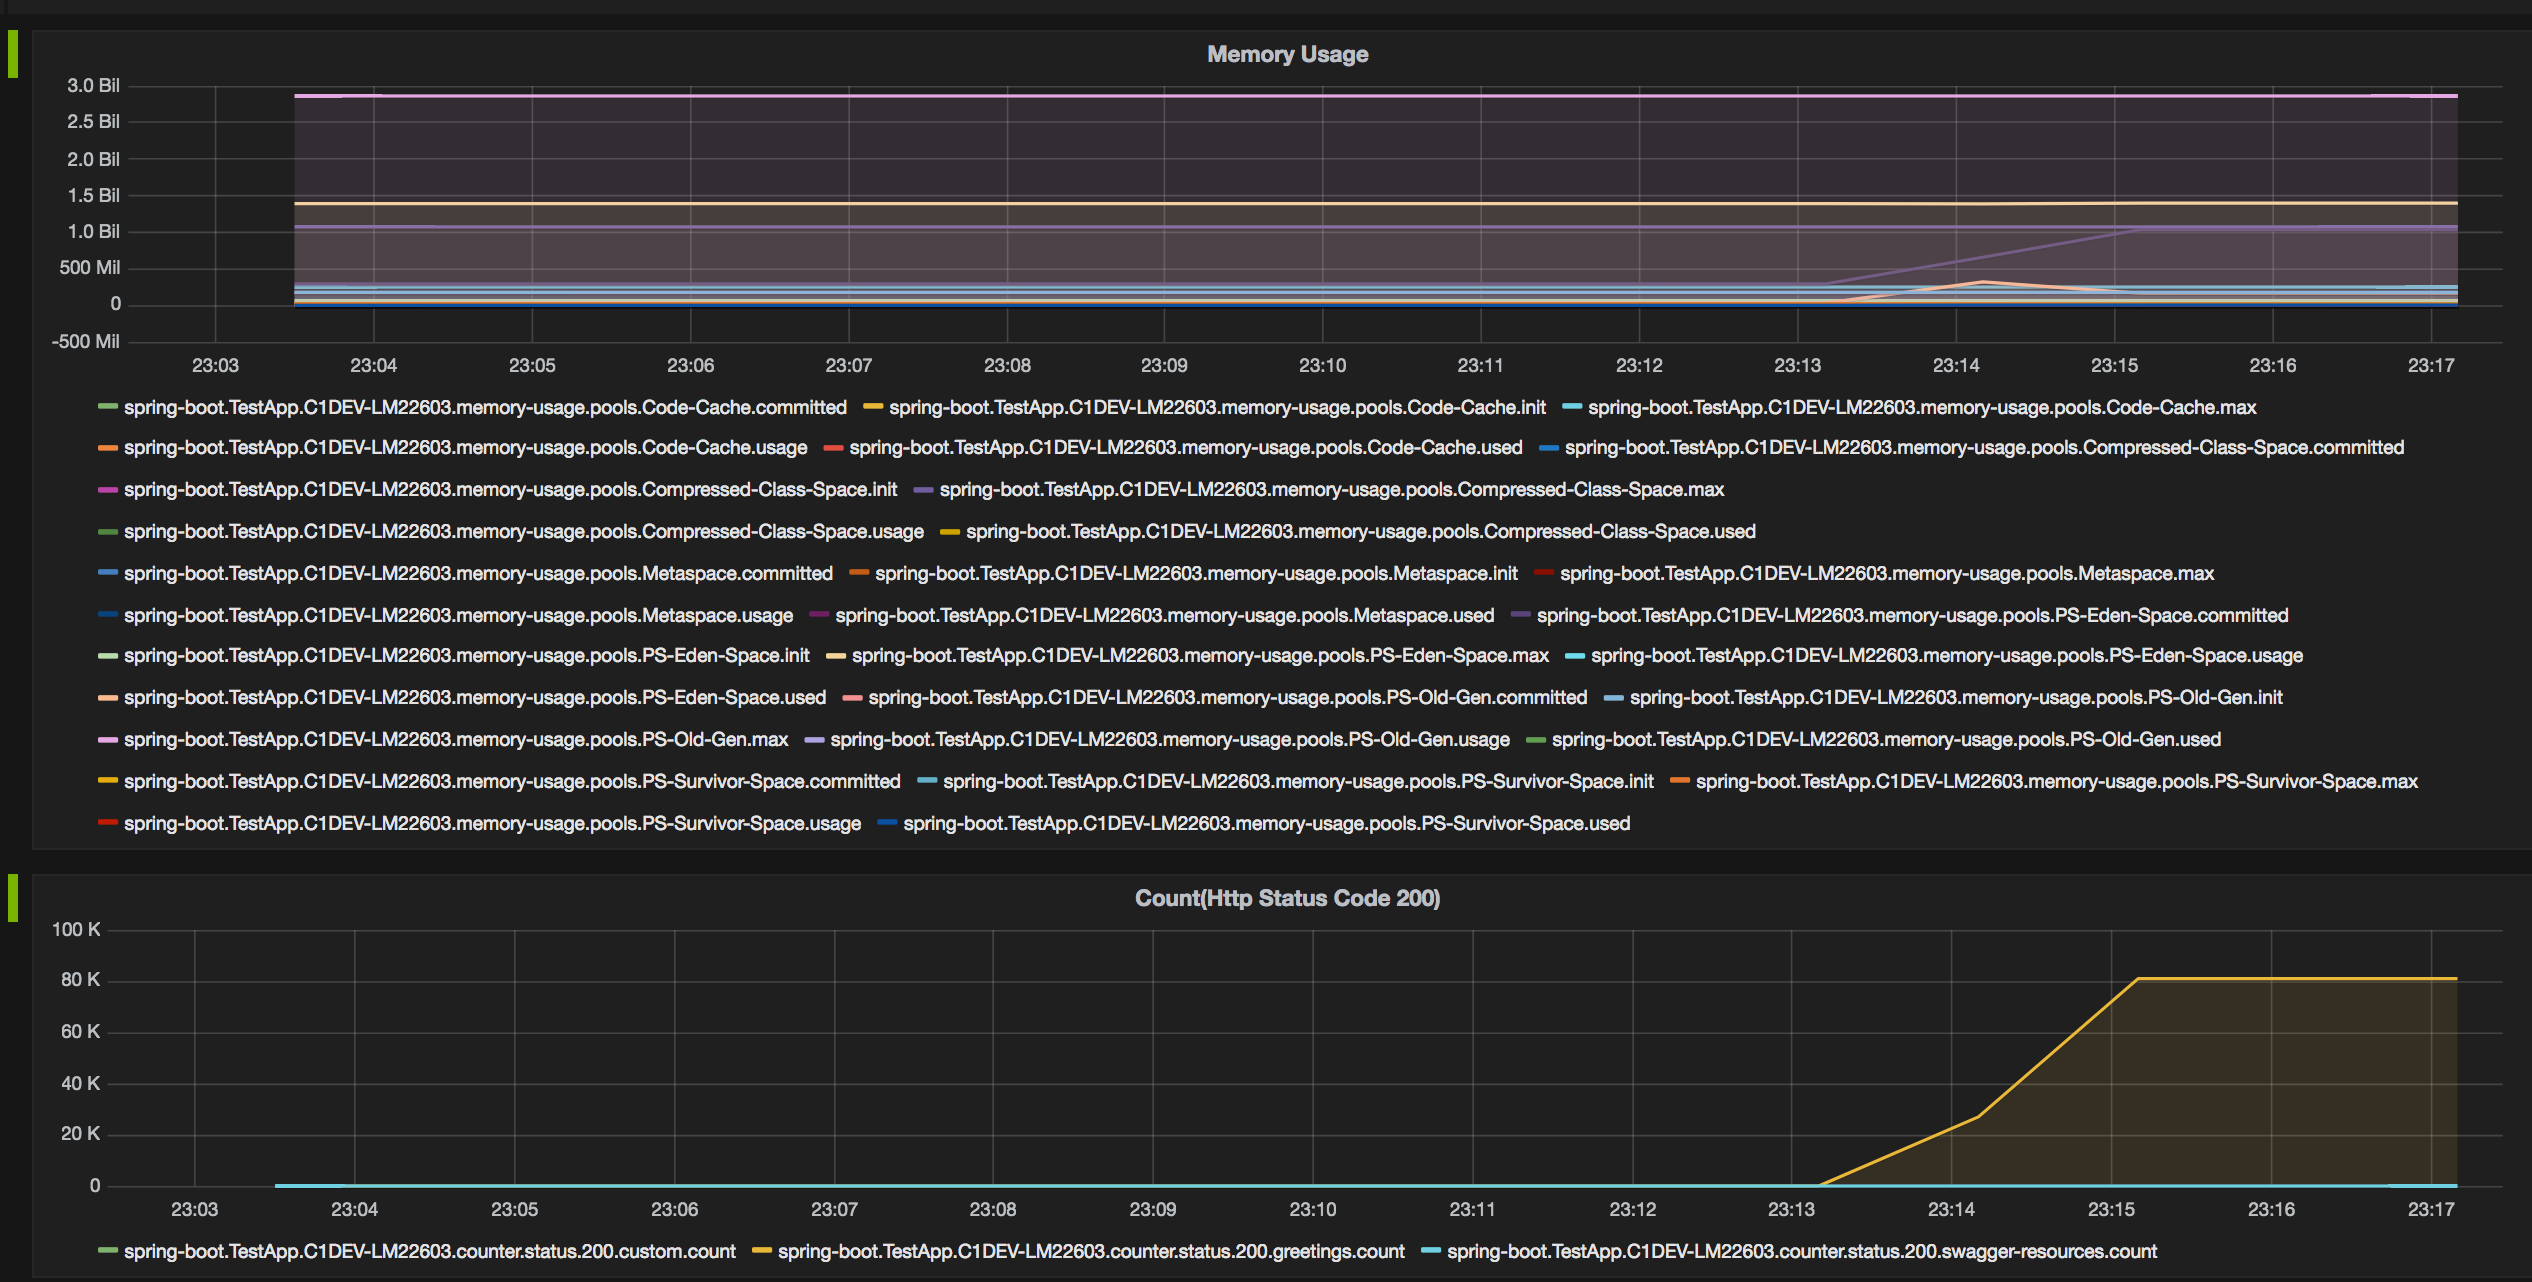
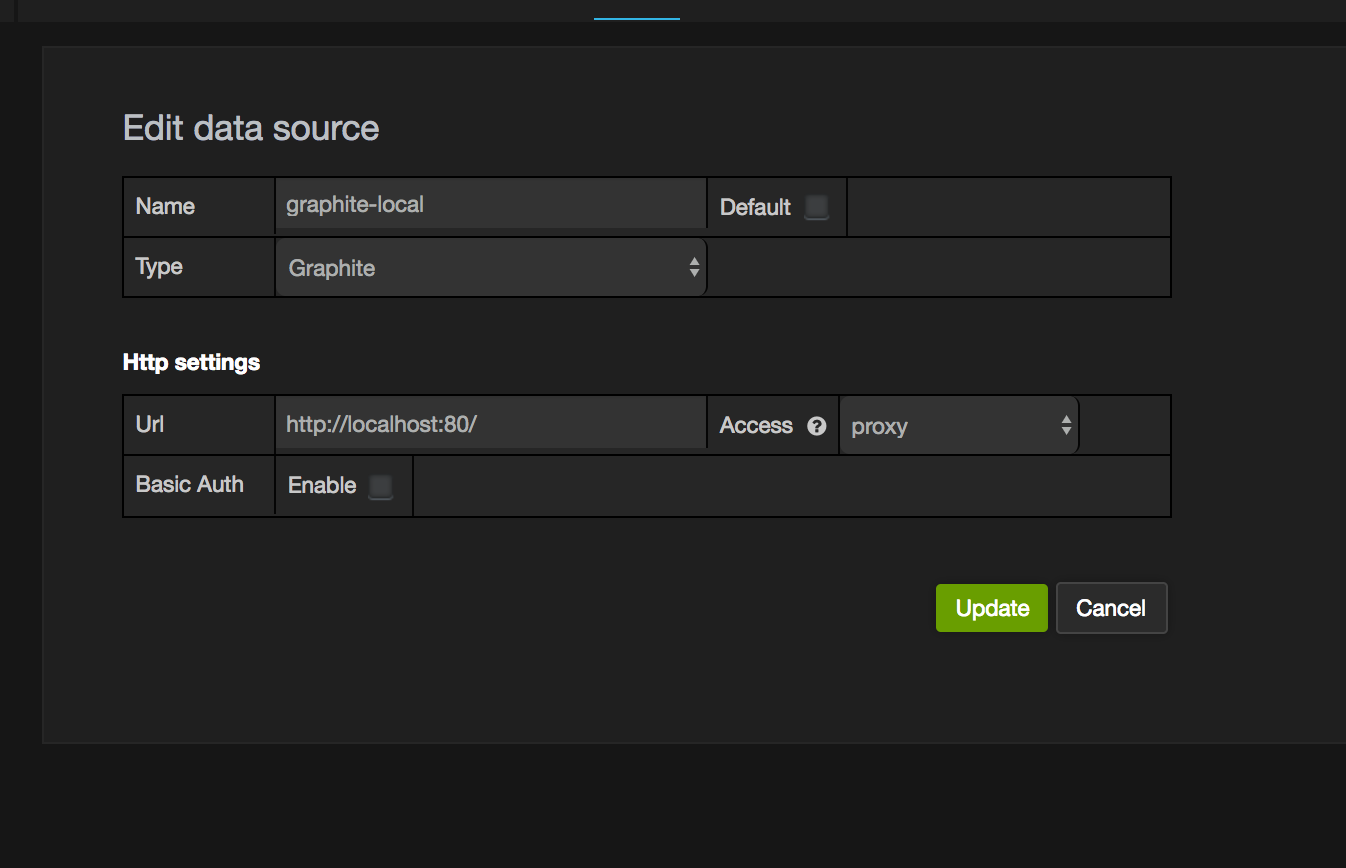
Configuring dashboard in Grafana
Grafana is a great tool to visualize these metrics being sent to graphite. Add a datasource for setting up this dashboard
After that start creating you dashboard as below.